

Melrose Market Update - August 2023

Ilya Jacob Rasner
Meet Ilya, a real estate agent who has been serving clients in the Greater Boston area for over 17 years...
Meet Ilya, a real estate agent who has been serving clients in the Greater Boston area for over 17 years...
Let's dive into the captivating world of Melrose, MA's real estate market. Wee'll explore key metrics that shed light on the local real estate landscape, offering valuable insights to both buyers and sellers. Whether you're looking to invest, sell, or buy a property in Melrose, understanding these numbers is crucial for making informed decisions.
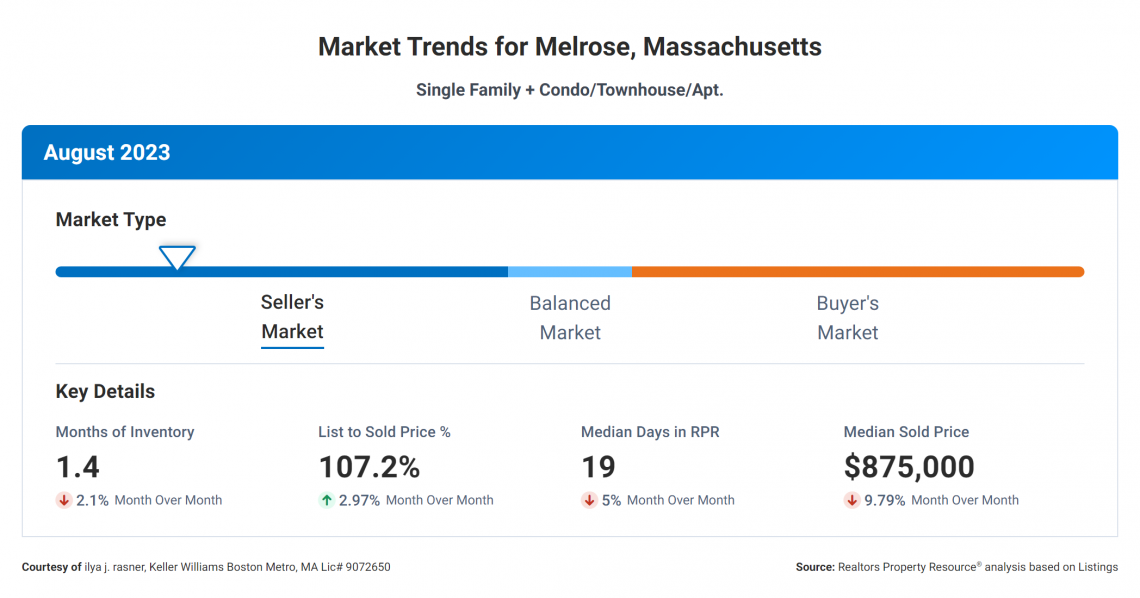
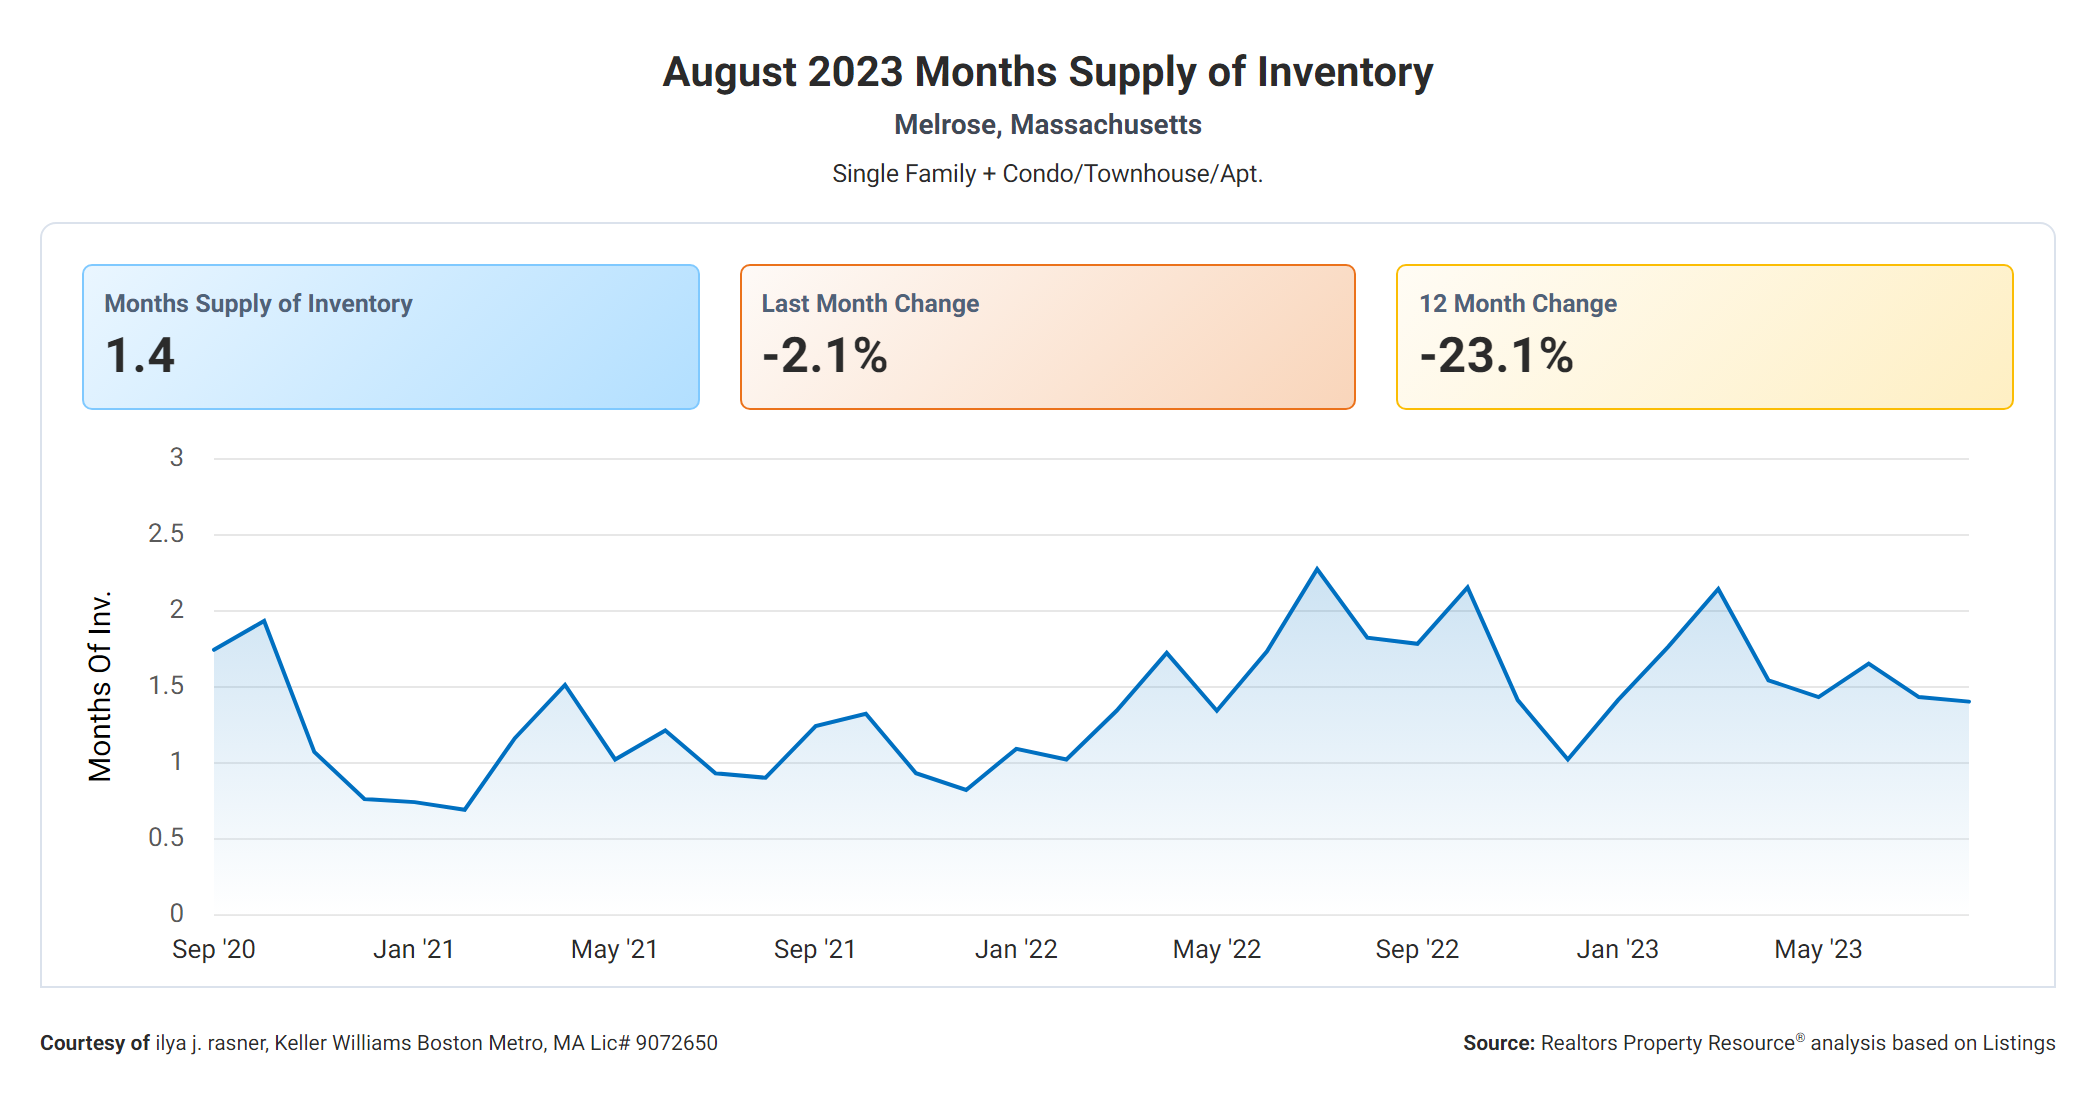
Let's begin with the Months Supply of Inventory, a pivotal metric that currently stands at a mere 1.4 months in Melrose, MA. This figure represents the estimated time it would take to sell all the homes currently on the market at the present sales pace. In Melrose, this low supply of inventory is a clear indicator of a seller's market, where demand surpasses supply. Such conditions often lead to higher property prices, making it an advantageous time for sellers.
.png?w=1140)
Examining the 12-Month Change in Months of Inventory, we witness a significant decrease of -23.1%. This negative percentage reflects a tightening market over the past year, as the inventory of available homes in Melrose has decreased. As inventory shrinks, competition among buyers intensifies, potentially resulting in higher selling prices. For sellers, this trend presents an excellent opportunity.
Melrose's real estate market boasts a rapid pace, with the Median Days Homes are On the Market standing at just 19 days. This metric indicates the average time it takes for a home to sell after being listed. A lower median days on the market suggests increased demand and the potential for higher prices, requiring buyers to act swiftly in this competitive environment.
.png?w=1140)
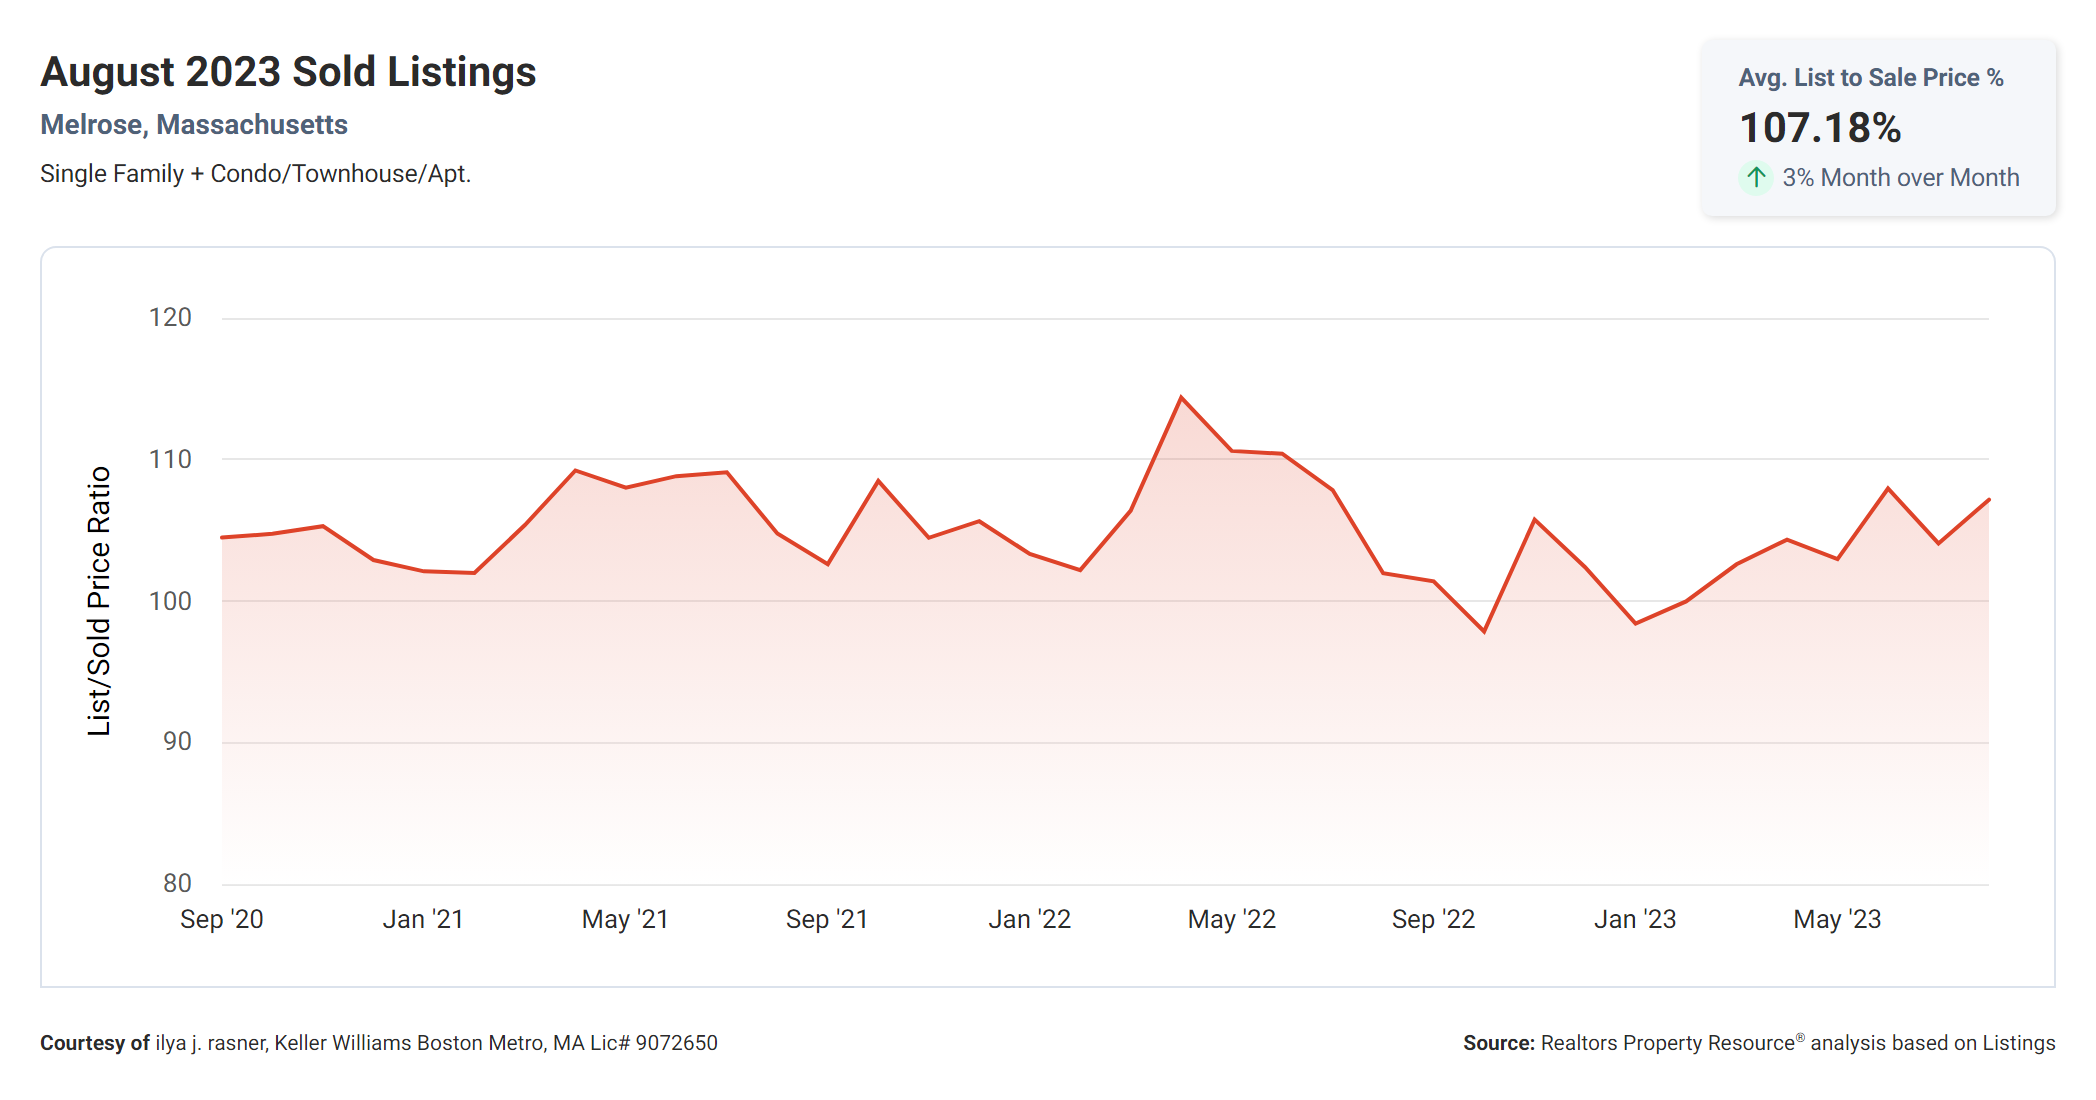
The List to Sold Price Percentage is an impressive 107.2% in Melrose, MA. This metric calculates the ratio between the final sold price of a home and its initial list price. A percentage this high signifies that homes consistently sell for more than their original asking price. High demand, a small supply, and aggressive bidding among buyers are indicators of a strong seller's market. Sellers in Melrose can capitalize on this favorable situation.
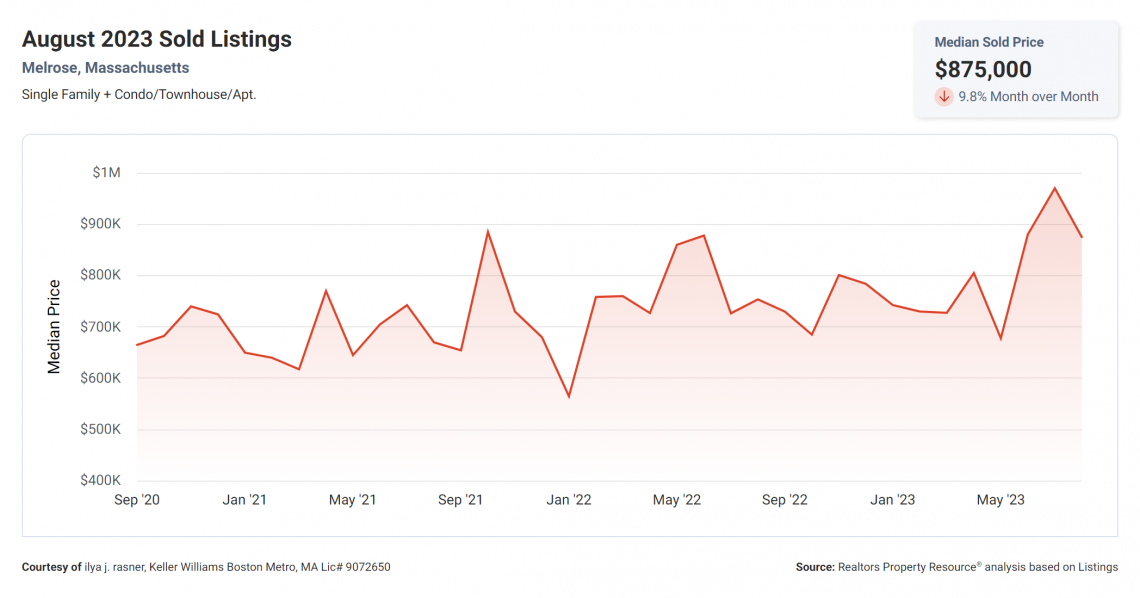
The Median Sold Price in Melrose, MA currently stands at a remarkable $875,000. This metric represents the midpoint of all the sold prices in the area. A higher median sold price reflects a robust real estate market where buyers are willing to pay a premium for properties. Sellers in Melrose can take advantage of this positive trend by potentially securing higher selling prices.
In Melrose, MA, the correlation between these real estate metrics paints a clear picture of a strong and competitive seller's market. The low supply of inventory, declining trend in months of inventory, swift turnover of homes, high list to sold price percentage, and substantial median sold price all indicate a market that favors sellers.
For buyers, this market dynamic implies potential bidding wars and the need for swift decision-making. On the other hand, sellers in Melrose can leverage these favorable conditions to maximize their property's value.
To delve even deeper into the data and gain additional insights, here's the link to download this month's comprehensive market report:
August 2023 Market Trend Report
We hope this information proves invaluable in your Melrose real estate endeavors.